# Is it an application for end-user? <Top>
No, Visual Graph is an ActiveX COM component, can let programmers use graphic functions in other programming languages.# What is the difference between Enterprise License and Industrial License? <Top>
Visual Graph ActiveX component contains Design and Run modes, the Industrial License only has Run mode, Enterprise License has the two modes.# What is Design mode? <Top>
Briefly, it is WYSIWYG programming. There are many programming languages have Design mode, such as C#, Delphi, VB, PB. And some graphic software also have Design mode, such as AutoCAD, PowerPoint. The characteristics of Design mode are: can draw controls by mouse, drag and drop controls by mouse, change control's size or position.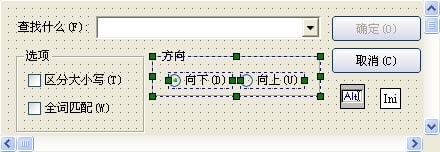
# What is Run mode? <Top>
You can simply understand it as the software product that developed by the programming languages. There are many programming languages have Run mode, such as C#, Delphi, VB, PB. And some graphic software also have Run mode, such as Flash, PowerPoint (when play), but some special graphic software have not Run mode, such as AutoCAD, Adobe Photoshop. The characteristics of Run mode are: cannot edit any graph or control, but the control or graph can respond some events and make some actions (HMI).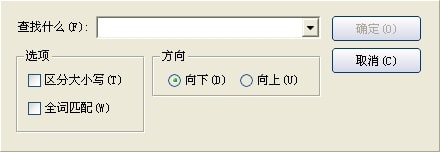
# Since Industrial License has not Design mode, then how to draw graphs if I purchased an Industrial License? <Top>
Visual Graph provides you with the IDE in the downloaded package, and it is FREE FOREVER, you can use it to draw graphs or provide it for end-user to draw graphs. But, the graphic ActiveX component does not contain drawing function if you use Industrial License, and you cannot develop drawing software use it, so, please investigate your requirements clearly before purchase.# Can I use it in Internet Explorer? <Top>
Yes, it will run as a plug-in, of course, you need JavaScript or VBScript to operate it. The following screenshot is a running interface (This ActiveX plug-in is security certification, file size is less than 1 MB).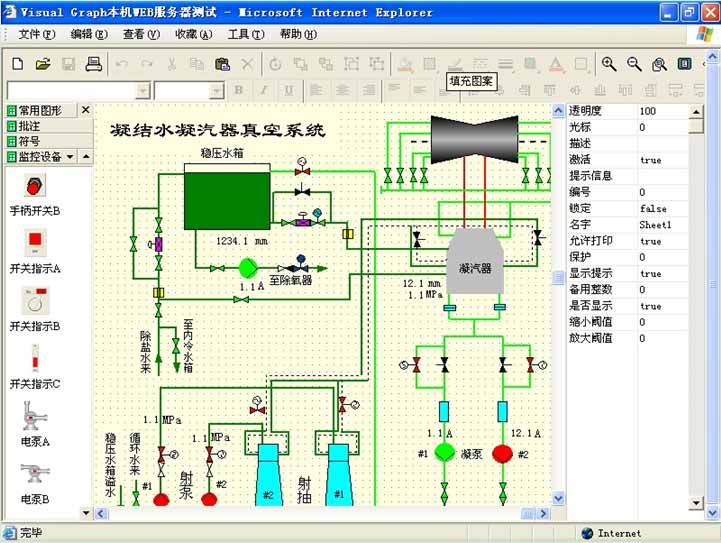
# Does it support database? <Top>
Visual Graph does not support database directly, to set the property value of a graph as the data that retrieved from database, please retrieve data first, and then call Visual Graph's COM interface to set value. This way is similar to other programming languages. For instance, there is a TextBox named "Text1", we need to set its Length property as the data (50, retrieved from database), just use below sentence:vgctrl1.vg.ActiveSheet.Execute("Text1.Length = 50");
or
vgctrl1.vg.ActiveSheet.UnitByName("Text1").SetPropertyValue("Length", 50);
If you want to save graph's data to database, please get value through Visual Graph's COM interface first, and then save it to database. The following sentence can get the value of Text1's Text property:
s = vgctrl1.vg.ActiveSheet.Execute("return Text1.Text");
or
s = vgctrl1.vg.ActiveSheet.UnitByName("Text1").GetPropertyValue("Text");
# Why cannot change the size of some elements? <Top>
Because these elements contain rotated graphs, but you can change their size in OnResize event.# Encountered LoaderLock error when compiling in .NET, how to do? <Top>
Please click "Debug -> Exceptions" menu item, and turn off "LoaderLock" option under "Managed Debugging Assistants" category.# I use Delphi, but cannot load graphic file in FormCreate event? <Top>
Please execute Run or Design method in FormShow event to load graphic file.# Why cannot add Visual Graph ActiveX to Visual Studio toolbox in web programming? <Top>
Because Visual Graph ActiveX component running in client side, not server, do not need this.# How to draw a transparent tank that commonly used in chemical industry? <Top>
1. Draw a quadrilateral (5 vertexes) by using "polygon" basic graph, like this: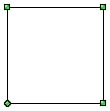
2. Click "Line -> Toggle line/Bezier" menu item, and then click top and bottom sides of this polygon, these sides will be converted to Beziers. Now, click each vertex, will appear two points that can control Bezier direction near vertex. Hold down the <Shift> key, move these control points to change the direction of Beziers, like this:
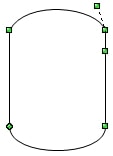
3. Draw another graph like above and align them to middle, and then select them, click "Line -> Merge line" menu item the make them as one graph, set its background color as white, foreground color as black, fill it whit 243 pattern, like this:
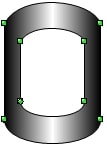
4. Draw a rectangle, blue background, put it under above graph, like this:
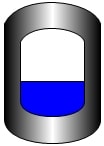
This is only first step of make a transparent tank, as for how to write code and add properties to let the blue fluid can move up and down, please refer to the tank in lib\monitor.tbl graphic library, or view the tank in demo\monitor\chemical industry.tbl graphic file.
# Do I need to combine graphs when I make a graphic element? <Top>
No. Because library and graph is the same file (.tbl), and one graphic element uses one sheet of .tbl file, so when you draw a library, please do not combine the graphs, if so, this library will only contain an element, one more thing, do not use numeric in sheet name.# Which color format does Visual Graph use? <Top>
Visual Graph use Windows RGB color, not HTML color, please note it.# Except lib folder, is there any graphic library for use? <Top>
Yes, controls.tbl and menu.tbl under bin folder are graphic libraries for you use.# How to load the .tbl graphic file on WEB server side? <Top>
If you cannot load it, please change its extension to .xml or .txt, maybe this extension is disabled by your WEB server.# Why cannot input character to text element in VC or Delphi? <Top>
Please refer to the VC6 code in source\vc60 folder, at here, you need to process PreTranslateMessage message, similarly, need to process CMDialogKey event, about how to moving the cursor in Delphi, please refer to the corresponding source code also. Other programming languages have not this issue.# Why cannot set breakpoint to debug program and often encounter some strange errors in VC6? <Top>
Please check the settings of your monitor or secure applications or close them.# How to save graph as .jpg file? <Top>
Use the Export function of Document class, e.g. execute export("e:\test.jpg", "jpeg", 0, 0) in IDE.exe.# Why cannot set color properly? <Top>
Please compare the following two sentences:Rect1.SetPropertyValue("BackColor", 255)
Rect1.SetPropertyValue("BackColor", "255")
The first is correct, another is incorrect, because color is a number, not a string.
Similarly, the following sentence is error due to the value of Text property is a string.
Rect1.Text = 100
# How to zoom graph by mouse wheel? <Top>
Just process OnMouseWheel event, if Forward parameter is true, increase the value of Zoom property, else decrease it. You can also refer to "demo\power\power system.tbl" file to know more detail.# How to determine which graph was clicked by mouse? <Top>
Call Document class member function UnitAtCursor in OnClick event, and then determine the clicked graph/control according to the return value. Please see the following samples:Visual Basic
                  Dim aunit As IUnit
                  Set aunit = vgctrl1.vg.UnitAtCursor(nothing)
                  If Not (aunit Is Nothing) Then MsgBox aunit.Name
Delphi
                  var
                     aunit : IUnit;
                  begin
                     aunit := vgctrl1.vg.UnitAtCursor(nil);
                     if (aunit <> nil) then ShowMessage(aunit.Name);
                  end;
Visual C++
                  CUnit aunit = vgctrl1.GetVg().UnitAtCursor(0);
                  if(aunit) ShowMessage(aunit.GetName());
# How to use color in .NET? <Top>
                  System.Drawing.Color cl;
                  int n = System.Drawing.ColorTranslator.ToWin32(cl);
It converts the .NET color to Visual Graph color (RGB).
# Why cannot register vg.dll by regsvr32 in Windows Vista/7+? <Top>
Please run cmd.exe as administrator, and the run bin\RegisterActiveX.bat or regsvr32 bin\vg.dll.# How to access the property of a graphic element's internal graph? <Top>
For instance: Element1 has a rectangle named Rect1, the following script will set Rect1's transparency to 50 (translucent):Element1.Rect1.Alpha = 50
If you use COM interface, like this:
vgctrl1.vg.ActiveSheet.Execute("Element1.Rect1.Alpha = 50");
or
vgctrl1.vg.ActiveSheet.UnitByName("Element1").UnitByName("Rect1").Alpha = 50;
or
vgctrl1.vg.ActiveSheet.UnitByName("Element1").Execute("Rect1.Alpha = 50");
# How to use two-dimensional array? <Top>
Just like this:
                  ar = Array()
                  ar[0] = Array()
                  ar[0][0] = 100
                  ar[0][1] = "Hello"
                  ar[1] = true
You can know from above, the first element of an array is an array also, the second element is logical value - true.


 Auto Mail Sender™ Standard Edition
 Auto Mail Sender™ Birthday Edition
 Auto Mail Sender™ File Edition
 Email Checker Pro
 TSSI .NET SMTP Component
 PDF to X
 PDF to DOC
 PDF to JPG
 PDF to Text
 PDF to HTML

 * Monitor Computer/Phone
 * Alfa eBooks Manager
 * Plagiarism Detector
 KeyMusic
 Advanced Date Time Calculator

 WinExt®
 * Files / Directories Recovery
 WinExt® Key Launcher
 WinExt® Batch Operator
 Duplicate File Finder Plus
 Duplicate Photo Finder Plus
 1Tree Pro
 Duplicate MP3 Finder Plus
 Advanced Recent Access
 tail for Windows

 * Say Goodbye to Ads
 * Download Online Video
 * Free Remote Desktop

 * Full Range Design Software
 * Posters & CD/DVD Covers

 Access Password Recovery

 Easy Work Time Calculator
 Date Time Counter
 WinExt® Privacy Protector
 WinExt® Registry Fixer
 WinExt® System Cleaner
 WinExt® System Optimizer
 WinExt® Bulk Renamer
 File & Folder Lister
 VB 6 Pure Code Lines Calculator
 Process Guard for Developer
 Visual Graph - Powerful Industrial Graph ActiveX Component - FAQ


