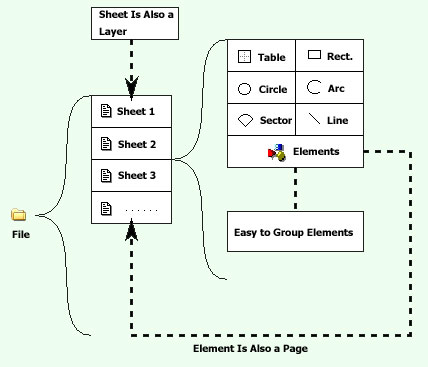
Visual Graph files use the standard XML format, and saved as utf-8 encoding, a file contains multiple sheets, a sheet contains multiple graphs, the graph can be the textbox, rectangle, circle, arc, pie, sector, line or any other custom elements. See the structure below:
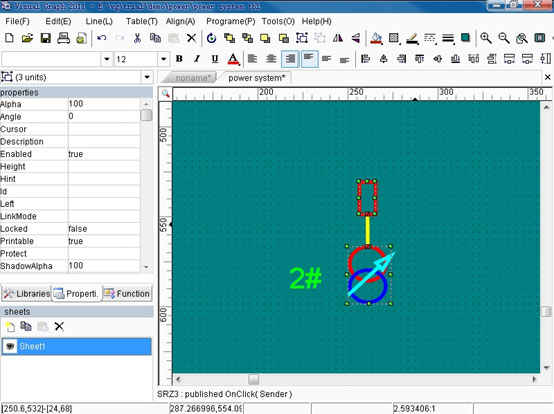
For instance: the following picture is a very typical relationship of two-winding and the circuit breaker in power system, among it, the file includes a page (sheet1), sheet1 includes 4 graphs: a rectangle, a line, a circuit breaker and a two-winding element.
Now, save this file with xml extension, you can see its source code in your Browser.
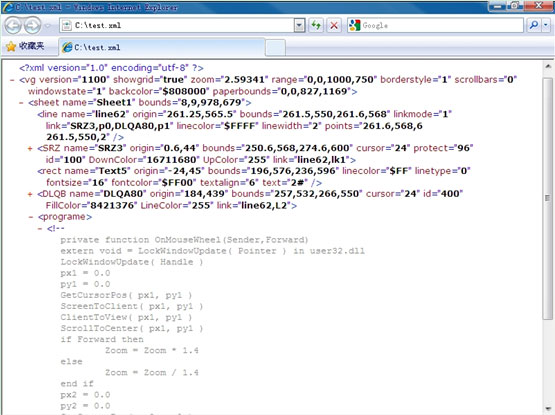
Please pay attention to DLQB element, it contains three basic graphs and some scripts. In the script code, achieved the processing logic when the mouse wheel to scroll. Visual Graph script language can make the complex and powerful graphic element.
Visual Graph file is composed by multiple pages (sheets) image files, and you can draw graphs on every sheet.
Graphic files and library files are the same format (XML), if a graphic file is used as graphic library, a sheet is a graphic element.
To edit graphic library, only need to open this .tbl file and edit its sheets (a sheet is an element).
Unified format is very important, this is more convenient for make the nested elements. This is similar to the popular programming languages - some controls can be embedded in a window/form, Visual Graph's sheet is similar to the window/form, elements are similar to the controls.
With the internal scripting language, you can use Visual Graph to develop various complex elements that contain some variables, properties and events.
Basic graphs with the layer-by-layer combination will be a huge Visual Graph graphic system.
On the sheet, every graph has a unique name and some properties, such as color, position, size, rotation, transparency, and so on. The basic graphic element has its own properties, such as the arrow of a line, these are the fixed properties that supported by Visual Graph.
And you can add the custom properties for a graph, for instance: on a map, you can add "population" and "area" properties for every province. The saving format and access method of these custom properties are similar to the fixed properties, for instance: you can use "NewYork.Area" sentence to access the "Area" custom property of New York province.
Every graph of Visual Graph is COM object, you can operate them/make change/draw in any COM supportable programming languages.
Visual Graph's sheet has 3 different purposes:
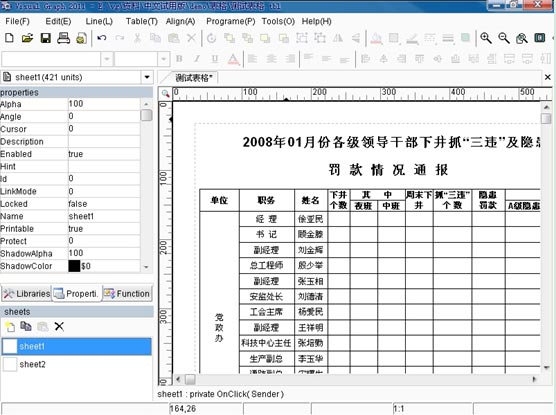
1. If the business requires more than one interface, and these interfaces have a relationship or are similar, then you can use the sheet to render each interface. The following graphic file has two sheets/tables, you can conveniently manage and print them in one .tbl file.
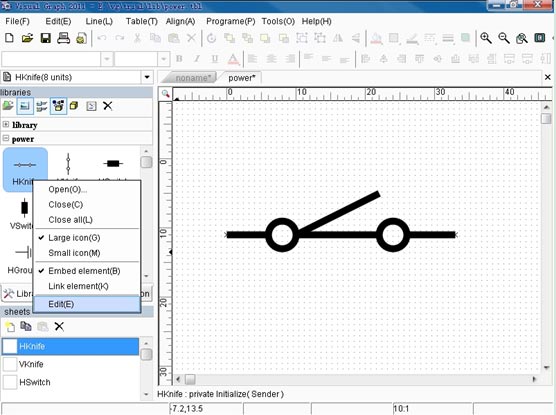
2. Use sheet as a graphic element, the file format of elements library is similar to general graphic file, so you can load it as graphic library by click "File -< Open Library..." menu item, also can be loaded as general graphic file for editing. Such as the following graphic file (power.tbl), it is loaded as a graphic elements library at left ('power' group), and also is opened as a general graphic file and you can edit each page, an element in library is corresponding to a sheet in the graphic file.
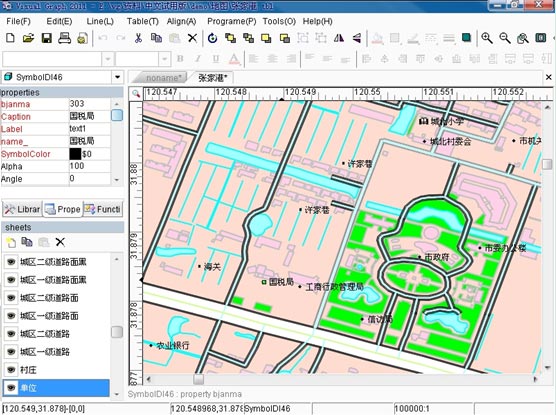
3. Use sheet as layer, the concept of sheet is similar to the layer. Such as a map contains multiple layers usually, some are visible, some are invisible. The layer can be locked, and can be set to show or hide when zooming it. The map data can be converted from MapInfo and the registered version provides you with this tool.
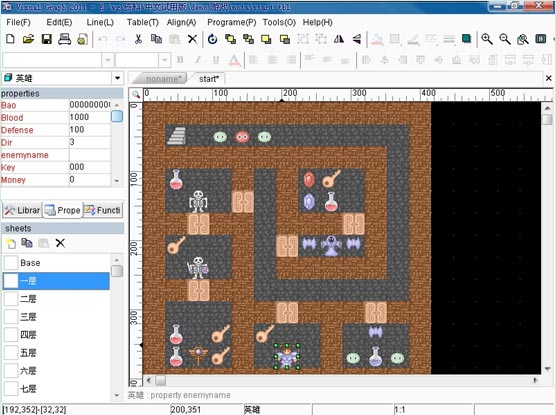
Below is the design interface of the famous game "Magic Tower", it contains more than twenty floors, each floor is a sheet.

For instance: the following picture is a very typical relationship of two-winding and the circuit breaker in power system, among it, the file includes a page (sheet1), sheet1 includes 4 graphs: a rectangle, a line, a circuit breaker and a two-winding element.

Now, save this file with xml extension, you can see its source code in your Browser.

Please pay attention to DLQB element, it contains three basic graphs and some scripts. In the script code, achieved the processing logic when the mouse wheel to scroll. Visual Graph script language can make the complex and powerful graphic element.
Visual Graph file is composed by multiple pages (sheets) image files, and you can draw graphs on every sheet.
Graphic files and library files are the same format (XML), if a graphic file is used as graphic library, a sheet is a graphic element.
To edit graphic library, only need to open this .tbl file and edit its sheets (a sheet is an element).
Unified format is very important, this is more convenient for make the nested elements. This is similar to the popular programming languages - some controls can be embedded in a window/form, Visual Graph's sheet is similar to the window/form, elements are similar to the controls.
With the internal scripting language, you can use Visual Graph to develop various complex elements that contain some variables, properties and events.
Basic graphs with the layer-by-layer combination will be a huge Visual Graph graphic system.
On the sheet, every graph has a unique name and some properties, such as color, position, size, rotation, transparency, and so on. The basic graphic element has its own properties, such as the arrow of a line, these are the fixed properties that supported by Visual Graph.
And you can add the custom properties for a graph, for instance: on a map, you can add "population" and "area" properties for every province. The saving format and access method of these custom properties are similar to the fixed properties, for instance: you can use "NewYork.Area" sentence to access the "Area" custom property of New York province.
Every graph of Visual Graph is COM object, you can operate them/make change/draw in any COM supportable programming languages.
Visual Graph's sheet has 3 different purposes:
1. If the business requires more than one interface, and these interfaces have a relationship or are similar, then you can use the sheet to render each interface. The following graphic file has two sheets/tables, you can conveniently manage and print them in one .tbl file.

2. Use sheet as a graphic element, the file format of elements library is similar to general graphic file, so you can load it as graphic library by click "File -< Open Library..." menu item, also can be loaded as general graphic file for editing. Such as the following graphic file (power.tbl), it is loaded as a graphic elements library at left ('power' group), and also is opened as a general graphic file and you can edit each page, an element in library is corresponding to a sheet in the graphic file.

3. Use sheet as layer, the concept of sheet is similar to the layer. Such as a map contains multiple layers usually, some are visible, some are invisible. The layer can be locked, and can be set to show or hide when zooming it. The map data can be converted from MapInfo and the registered version provides you with this tool.

Below is the design interface of the famous game "Magic Tower", it contains more than twenty floors, each floor is a sheet.


 Auto Mail Sender™ Standard Edition
 Auto Mail Sender™ Birthday Edition
 Auto Mail Sender™ File Edition
 Email Checker Pro
 TSSI .NET SMTP Component
 PDF to X
 PDF to DOC
 PDF to JPG
 PDF to Text
 PDF to HTML

 * Monitor Computer/Phone
 * Alfa eBooks Manager
 * Plagiarism Detector
 KeyMusic
 Advanced Date Time Calculator

 WinExt®
 * Files / Directories Recovery
 WinExt® Key Launcher
 WinExt® Batch Operator
 Duplicate File Finder Plus
 Duplicate Photo Finder Plus
 1Tree Pro
 Duplicate MP3 Finder Plus
 Advanced Recent Access
 tail for Windows

 * Say Goodbye to Ads
 * Download Online Video
 * Free Remote Desktop

 * Full Range Design Software
 * Posters & CD/DVD Covers

 Access Password Recovery

 Easy Work Time Calculator
 Date Time Counter
 WinExt® Privacy Protector
 WinExt® Registry Fixer
 WinExt® System Cleaner
 WinExt® System Optimizer
 WinExt® Bulk Renamer
 File & Folder Lister
 VB 6 Pure Code Lines Calculator
 Process Guard for Developer
 Visual Graph - Powerful Industrial Graph ActiveX Component - File Format


